This started with a simple annoyance: my coding agent kept searching folders with over a million files in them, and grepping that takes forever. I run several agents in parallel and they burn about twice the 16M tokens a day I budgeted, so I assumed slow, wasteful searching was part of the problem. I built a local search index to test it: if the agent finds the right files faster, it should spend fewer tokens.
The index did find files much better. It did not make the agents cheaper. What actually fixed the original problem was boring: two ignore files. Here is what I built, what I measured, and why I'm switching the index off.
The short version:
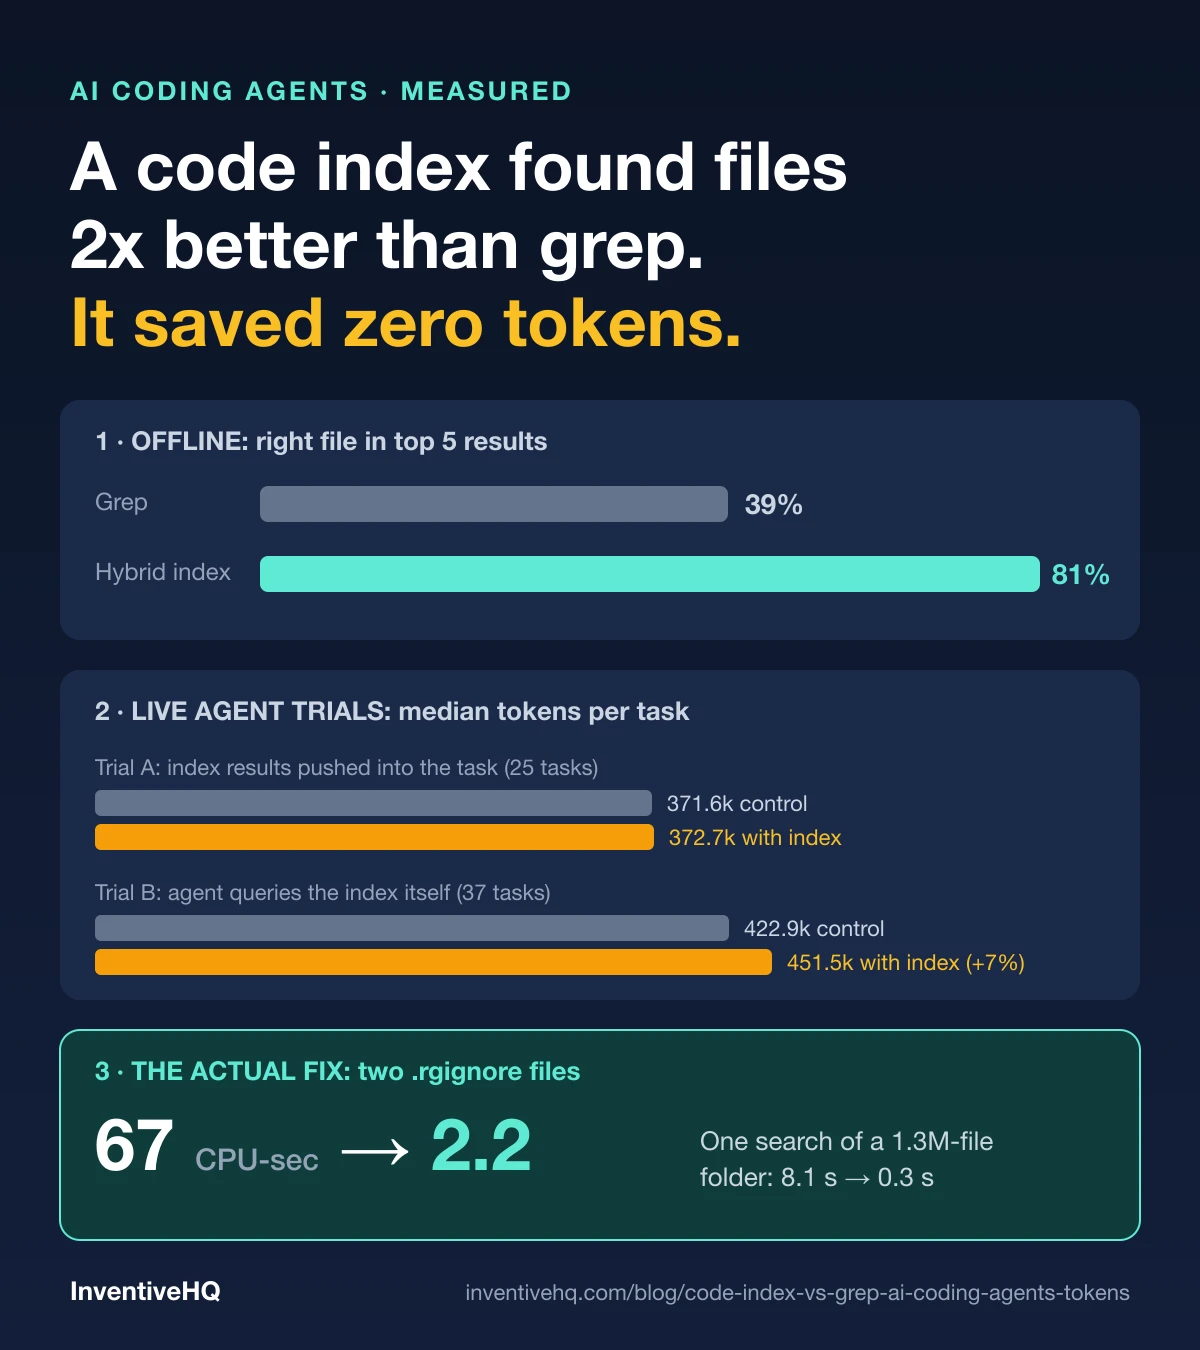
- The real fix was ignore rules. The box held 1.3 million files, and one search took 8.1 s and 67 CPU-seconds. Two
.rgignorefiles brought it to 0.3 s and about 2 CPU-seconds. - Offline, the index wins clearly. Hybrid search hit the right files in the top 5 results 81% of the time versus 39% for simulated grep.
- In real runs it did not help. Trial A (index results pushed into the task) had identical median tokens. Trial B (agent queries the index itself) used about 7% more tokens, within noise.
- Both trials were small and noisy, so read this as "no sign of a win", not "proven useless."
- The token burn is probably elsewhere: re-runs, parked looping tasks and repeated verify phases.
The full numbers, caveats and reproduction commands are in the results write-up (sanitized copy of my internal notes).
What was actually wrong: 1.3 million files
On the day the machine got very slow, several agents were each running rg --files from the top of a projects drive. That drive held 1,320,034 files: worktrees, runner checkouts, retired agent trees and run output. Three searches at once used about 5 of 12 cores.
Measured by finding one file by name from the root (median of 3):
| Setup | Wall time | CPU time |
|---|---|---|
| No ignore file | 8.1 s | 67.0 CPU-s |
Root .rgignore (worktrees, checkouts, scratch) | 6.7 s | 54.3 CPU-s |
Plus a second .rgignore inside the agent-runs folder | 0.3 s | about 2.2 CPU-s |
The first ignore file only helped 16%, which was the clue. The rest came from one folder holding just 8,030 files but 394,890 directories: about 253 per agent run, from git object fan-out. Opening those directories cost roughly 50 seconds of kernel time per search. The other 42,867 top-level files cost 0.33 s. It was not antivirus and not the drive. Skipping that one folder cut CPU about 30x.
Two caveats. An ignore file only applies to searches that start at that folder, so a search started inside a worktree or given an explicit path is unaffected. And the 395k directories still exist, so anything else that walks them (backups, robocopy, full antivirus scans, git) is still slow. Deleting finished run folders is the real cleanup.
A separate find: the busiest Windows Defender scanner was the agent itself, opening its own session transcripts (23 GB across 4,152 files, some 2 GB) 62 times in a 25-second recording, up to 2.8 s per scan. Excluding that folder from scanning made those scans disappear.
I only found this after building the index. It also made a full-disk file-name index pointless: a 2.57M-row prototype took 368 s to build, and with the ignore files a root search was already 0.2 s.
What I built
A single SQLite file with two search methods over about 24,500 chunks of text: one repo, a notes vault, and roughly 6,400 past agent reports and plans.
| Piece | What it does |
|---|---|
| FTS5 | Keyword search (8 ms per query) |
| Vector search | 384-dimension MiniLM embeddings via the sqlite-vector extension |
| Hybrid | Both combined; about 520 ms per query, mostly model load |
| Trigram copy | A slimmer 113 MB gzipped index agents could query inside their container |
It builds incrementally by file hash, runs at low priority, and skips anything sensitive.
The offline benchmark: the index is much better than grep
I took 150 past commit subjects, turned each into a query, and checked whether the files that commit actually changed appeared in the results.
| Method | Top 5 | Top 10 |
|---|---|---|
| Grep (simulated) | 39% | 47% |
| FTS5 keywords | 69% | 75% |
| Vector | 65% | 78% |
| Hybrid | 81% | 89% |
Keyword search and vector search fail in different ways, which is why combining them beat either alone. A re-run with a trigram index on the grown corpus gave 71% at top 10, versus 40% for grep.
One honest caveat: the grep baseline is a simulation of keyword grep, not measured agents. Real agents are smarter than a single grep.
Trial A: push a "Discovery" section into the task
For about half of task families (assigned by hash), the runner appended a generated list of likely relevant files to the task. It failed open, so an index error never blocked a run.
| Arm | Families | Median tokens | Median minutes | Mean phases |
|---|---|---|---|---|
| Discovery | 14 | 372,713 | 23.8 | 11.5 |
| Control | 11 | 371,620 | 26.0 | 5.9 |
Tokens were identical. Minutes were two lower, but phases per task nearly doubled, which suggests the agents treated the file list as extra work to do rather than a shortcut. An early read of the same trial, before the last tasks finished, looked worse for Discovery (277k versus 205k tokens). The final numbers are neutral. I disabled it.
Trial B: let the agent query the index itself
Instead of pushing results, I staged the query tool and a slim database and added a short optional note.
| Arm | Families | Median tokens | Median minutes | Mean phases |
|---|---|---|---|---|
| Query tool | 20 | 451,494 | 26.9 | 6.15 |
| Control | 17 | 422,929 | 23.8 | 7.24 |
About 7% more tokens and three more minutes at the median, with slightly fewer phases. With samples this small that is within noise, but there is no hint of a win either.
Why this is direction only
Treat these as a reason to stop, not as a precise measurement:
- Task size varies enormously. A few large tasks can swing a 14-task median by tens of percent.
- Trial B is confounded. The agent version changed at 16:45 and the trial started at 16:49, so the two trials should not be compared with each other.
- Token totals include verify and landing phases, which a search index cannot help with.
- Few tasks finished. Only 6 of 17 to 20 per arm had landed, and unfinished tasks are not in the medians.
- The benchmark is not how agents search. It finds files from a commit-style query, but agents mid-task often already know the file from the task description.
What I'm doing instead
I'm keeping the tool as an optional lookup for planning and for humans, since it costs nothing when unused. I'm keeping the two .rgignore files and the Defender exclusion, which removed the real CPU hog. What they did not measure is token cost: the ignore files fixed CPU and wall time, and I have not shown they cut tokens.
The token burn is more likely in:
- Re-runs and looping tasks. Parked tasks and repeated verify or rework phases cost more than file hunting.
- Test reruns. 805 container jobs in 24 hours with a higher than I would like failure rate; many failures are expected, but each rerun costs a phase.
- Missing per-phase accounting. My logs only give totals per task, so I can't yet say whether plan, code, verify or land is the expensive part. That is the next thing to build.
If you want to retest this on your own setup, run it on tasks that start cold with no file list, hold the agent version fixed, and compare tokens per landed task over at least 30 tasks per arm.
The takeaway
If your agent is slow because it greps enormous folders, start with ignore files and scoped-search rules before building anything. They took minutes, and took a search from 67 CPU-seconds to about 2, which the index couldn't do. Better retrieval is not the same as cheaper agents. If you are trying to cut AI coding costs, measure where the tokens go by phase before building search infrastructure, and be suspicious of any benchmark that tests retrieval instead of the whole task. For the cost side, see how much Codex a ChatGPT plan buys, and to count tokens in your own prompts use the LLM token counter.